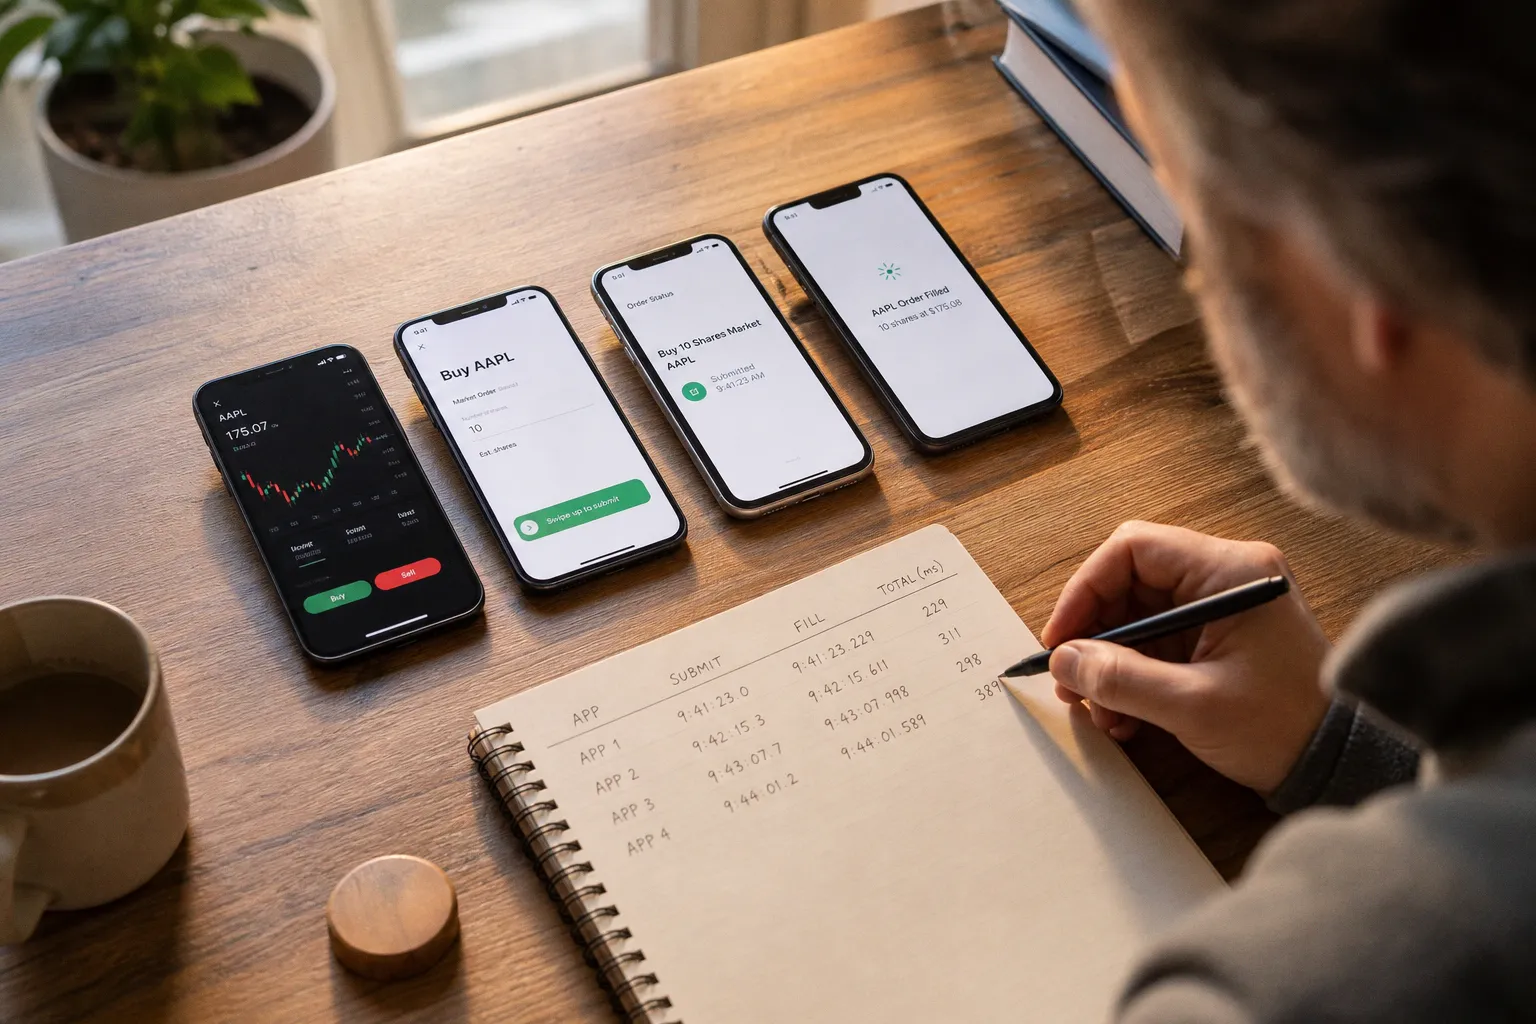
Measure order execution speed on 4 retail trading apps
The Fill Time You Never See Is the One Costing You Money
For fixed income specialists like myself, the concept is second nature. In bond markets, execution slippage is measured in basis points and dissected with ruthless precision. In equities — especially at the retail level — that same rigor evaporates. The rise of zero-commission trading has conditioned an entire generation of investors to believe the transaction itself is free. It is not. The cost has simply migrated from a visible line item to an invisible one: execution quality. And the primary component of execution quality, beyond price improvement, is speed.
This is not an abstract concern. During the March 2020 liquidity crisis, the spread between where a retail order was submitted and where it was actually filled widened dramatically for certain names. The investors who noticed were the ones who knew how to read the data. The rest simply assumed their app "worked fine." Let us dismantle that assumption.
The Reality of Retail Order Routing and Wholesalers
Here is the mechanical truth that most retail brokerage marketing departments would prefer you not dwell on: when you place an order through a mainstream retail app — whether it is Robinhood, Webull, Fidelity, or Charles Schwab — that order almost never goes directly to a public exchange like NYSE or Nasdaq. Instead, the vast majority of retail orders are routed to off-exchange wholesalers, principally Citadel Securities and Virtu Financial. These firms pay the brokerages for the privilege of executing your order flow — a practice known as payment for order flow, or PFOF — and in return, they handle the actual matching of buyers and sellers.
Why does this matter for execution speed? Because the latency chain is no longer Broker → Exchange → Fill. It is Broker → Wholesaler's Internal System → Internalization Engine → Fill. Each hop introduces milliseconds of delay, and the wholesaler's internal architecture — their matching engine speed, their queue management, their risk controls — becomes the dominant variable in how fast your order lands. You have no visibility into any of this. The brokerage's app may report a fill time, but that number is measured from their timestamp to the notification you receive, not from the moment the order reached the wholesaler's matching engine.
The downstream consequence is structural: your execution speed is not a function of your broker's technology alone. It is a function of your broker's routing agreement with whichever wholesaler won the bid for your order flow that quarter. Different brokers have different arrangements, and those arrangements change. The routing logic itself is often tiered — a small market order for a liquid large-cap stock may be handled by a different internalization path than a larger order or one in a less liquid name. This tiering means execution speed is not a fixed property of a given app; it is a variable that shifts with order characteristics, market conditions, and the wholesaler's current inventory position.
Your order's execution speed is not a feature of your brokerage app — it is a downstream artifact of an opaque routing agreement you never signed and cannot audit.
Decoding SEC Rule 605 Reports for Execution Quality
The closest thing retail investors have to a standardized window into execution quality is SEC Rule 605. Originally adopted in 2000, this regulation requires market centers — including wholesalers that internalize retail orders — to publish monthly electronic reports detailing execution statistics. These reports include metrics such as the speed of execution (measured in seconds from receipt to fill), the percentage of orders filled at or better than the national best bid and offer (NBBO), and the degree of price improvement received.
The SEC recently amended Rule 605 to modernize and expand disclosure requirements, a move that reflects growing regulatory attention to the opacity of retail execution. The amendments are significant because they push toward greater granularity — requiring more detailed breakdowns by order type, order size, and market condition — that will, in theory, allow sophisticated retail investors to make more meaningful comparisons.
In practice, however, these reports are dense, inconsistent in formatting across market centers, and written for compliance departments, not for individual investors trying to compare two apps. Here is what you can extract with some effort:
Key metrics available in Rule 605 reports:
1. Effective spread — the difference between the actual execution price and the midpoint of the NBBO at the time the order was received. A lower effective spread means you got closer to the "true" market price.
2. Price improvement rate — the percentage of orders that were filled at a price better than the quoted NBBO. This is the metric brokerages love to advertise, but it tells you nothing about speed.
3. Execution speed (mean and percentile) — reported in seconds, this measures the time from order receipt by the market center to execution. Look at the 95th and 99th percentile figures, not just the mean — the average tells you what happens on a calm Tuesday afternoon, while the tail tells you what happens when the market is actually moving.
4. Realized spread — a measure of how much the market moved after your fill, which is a proxy for adverse selection. If the price moved against you immediately after your fill, the wholesaler may have been warehousing risk that subsequently repriced.
The challenge is that no retail app surfaces this data natively. You are expected to go find the reports yourself — typically on the wholesaler's website or through the SEC's EDGAR system — and cross-reference them. This is a nontrivial research task, and it is one reason the execution quality question persists: the data exists, but the friction to access it is high enough that most investors simply do not bother.
| Metric | What It Measures | Why Retail Investors Should Care |
|---|---|---|
| Effective Spread | Distance from NBBO midpoint at order receipt | Direct measure of how much you overpaid or under-received |
| Price Improvement % | Orders filled better than quoted NBBO | Advertised heavily; tells you nothing about speed |
| Execution Speed (mean) | Average time from receipt to fill | Useful baseline; hides tail risk |
| Execution Speed (95th/99th pctile) | Worst-case fill times under stress | Reveals how the system performs when it matters most |
| Realized Spread | Post-fill price movement | Proxy for adverse selection — did the market move against you right after you were filled? |
Distinguishing Between UI Responsiveness and Network Latency
There is a persistent conflation in retail investor discussions between "how fast the app feels" and "how fast the order executes." These are two entirely separate technical phenomena, and confusing them leads to fundamentally flawed comparisons between platforms.
UI latency is the time it takes for your device to register a button press, render the confirmation screen, and display the order status update. This is a function of the app's front-end code, your phone's processor, your operating system, and the app's animation framework. It has absolutely nothing to do with how quickly your order reaches the market center or how fast the wholesaler fills it. An app can feel blazingly responsive — buttons animate instantly, the confirmation screen pops up in 200 milliseconds — while the actual order sits in a queue for several seconds before execution. Conversely, an app with a sluggish, stuttering interface may route your order to a faster execution pipeline.
Network latency is the time between when your broker's server receives your order and when the market center acknowledges receipt. This is the metric that actually matters for execution quality, and it is the one you cannot directly observe. It depends on the physical distance between the broker's servers and the wholesaler's matching engine, the network infrastructure connecting them, and the queuing logic at both ends.
Execution latency — the full chain from your tap to the fill — is a composite of app processing time, network transit, wholesaler queue time, matching engine processing, and the return path. The total can vary from under 100 milliseconds for a simple market order in a liquid name during calm conditions to several seconds during a volatility spike when the wholesaler's systems are under load.
Here is the practical implication: when you see a Reddit thread or a YouTube comparison declaring one app "faster" than another based on the perceived responsiveness of the interface, you are looking at a measurement that is entirely disconnected from the metric that affects your cost basis. The only way to approximate true execution speed is to independently timestamp your order submission and the fill notification, and even that introduces noise from your device's clock, the push notification delivery pipeline, and the app's own internal delays between receiving the fill confirmation from the wholesaler and displaying it to you.
There is no standardized speed test for retail trading apps. The "fast" feeling you get from a polished interface may be masking seconds of invisible latency in the execution pipeline you will never see.
Manual Methods for Tracking Your Order Fill Times
Since no retail brokerage provides a built-in execution speed dashboard — and since the metrics that do exist are buried in third-party regulatory filings — you are left with a set of manual, imperfect methods. None of them are laboratory-grade. All of them are better than relying on nothing.
Method 1: Screen-record your order submission. Use your device's screen recording feature, place a market order, and then scrub through the recording frame by frame. Note the timestamp on the frame where you tap "Submit" and the frame where the fill notification appears. This captures UI latency plus notification delivery latency but does not isolate network or execution latency. Run the same test on different apps, at the same time of day, for the same ticker and order size. The comparison is crude but directional.
Method 2: Use the broker's order status API or activity log. Some brokers — particularly Fidelity and Schwab — provide more granular timestamps in their order activity logs accessible via their web portals. Look for "Order Received" and "Order Filled" timestamps. The delta between them is closer to true execution latency, though it still includes broker-side processing time. Not all brokers expose this data at the same granularity.
Method 3: Cross-reference with time-and-sales data. After your fill, pull up the time-and-sales tape for the ticker (available on most level-2 platforms) and search for your exact execution price and quantity. Note the timestamp of that print. Compare it to your submission time. This gives you a market-side anchor point, though the print timestamp reflects when the trade was reported, not when it was matched, and reporting can itself be delayed by milliseconds.
Method 4: Analyze Rule 605 data over time. As discussed, the 605 reports from the wholesaler that handled your order provide aggregate execution speed statistics. They will not tell you about your specific order, but if you know which wholesaler your broker uses (this information is typically disclosed in the broker's 606 report, which details routing practices), you can track how that wholesaler's speed metrics trend over months and compare them to competing wholesalers.
What you will find when you do this: the differences between major retail apps are smaller than the marketing implies and larger than zero. Under normal market conditions, the variance in execution speed across Robinhood, Webull, Fidelity, and Schwab is likely measured in tens to low hundreds of milliseconds — meaningful for a day trader executing hundreds of orders, largely irrelevant for a long-term investor placing one order a month. The variance explodes, however, during high-volatility events, and that tail risk is where the real cost concentrates.
Why Retail Investors Cannot Match Institutional HFT Speeds
This point needs to be made bluntly because the marketing of certain retail platforms blurs a dangerous line: you will never achieve institutional-grade execution speed through a retail trading app. High-frequency trading firms operate with latencies measured in microseconds — sometimes single-digit microseconds — achieved through co-located servers physically adjacent to exchange matching engines, dedicated fiber-optic and microwave network paths, and hardware-level (FPGA) order processing that bypasses software entirely. The infrastructure investment runs into the hundreds of millions of dollars.
Retail execution, by contrast, travels through your phone's wireless connection, across public internet infrastructure, through your broker's servers, and then to a wholesaler's matching engine. The latency floor for a retail order is measured in milliseconds — roughly three orders of magnitude slower than institutional HFT. No app update, no "turbo mode" feature, no routing optimization will close that gap. It is a structural, physical constraint.
This does not mean execution speed is irrelevant for retail investors. It means you need to calibrate your expectations and focus your attention where it actually moves the needle. For a retail investor placing a limit order on a liquid ETF with a five-year holding period, execution speed differences of 200 milliseconds are noise. For a retail trader attempting to scalp momentum on a small-cap name during an earnings release, those same 200 milliseconds can represent the difference between a profitable fill and a loss — but even then, you are competing against participants whose latency advantage is insurmountable.
The honest framing is this: control what you can control. Use limit orders instead of market orders during volatile conditions to cap your downside on price slippage. Avoid trading in the first and last five minutes of the session, when spreads are widest and execution quality is most volatile. Understand which wholesaler handles your flow and track their Rule 605 metrics over time. And resist the temptation to conflate a fast-feeling app with fast execution — that confusion is, frankly, one of the quieter edges that the current retail brokerage ecosystem relies on.
The Defensive Posture
If the past decade of retail brokerage evolution has taught us anything, it is that cost transparency follows a predictable pattern: visible costs get eliminated (commissions go to zero), and invisible costs persist (execution quality remains opaque). The investor who understands this dynamic has a structural edge — not in speed, but in awareness.
Do not chase execution speed as a competitive advantage. You will lose that arms race before it starts. Instead, treat it as a risk factor to be monitored, the same way you would monitor duration risk in a bond portfolio or credit spreads in a high-yield allocation. Know where your orders go. Know how fast they get filled in normal conditions versus stress conditions. Know the difference between what your app shows you and what is happening to your order in the pipeline behind it.
The fill notification that pops up on your screen is the end of a story you were never allowed to read. Learning to read the footnotes — the 605 reports, the 606 routing disclosures, your own manual timing tests — is not paranoia. It is basic due diligence in a market structure designed to reward the informed and quietly tax the inattentive.
Related articles
 Brokerage & Trading PlatformsCompare Robo-Advisor Fees to Manual ETF Investing Costs
 Long semiconductors is the most crowded trade on record; Spain favoured to win World Cup
 SEC, CFTC Seek Public Comment on the Harmonization of Portfolio Margining Frameworks
 Brokerage & Trading PlatformsCompare Margin Rates of 4 US Brokers for Under $25k